Chart pattern trading is a method of trading based on the analysis of graphical patterns that asset prices can form on a chart.
This approach involves identifying recurring patterns in the price movements of an asset and making trading decisions based on these patterns.
There are various forms of chart patterns that traders look for, including
- Trend Trading: This chart pattern trading form involves identifying the overall price trend of an asset and taking positions in alignment with that trend. Trend traders aim to capitalize on long-term price movements by entering positions in the direction of the trend.
- Range Trading: This chart pattern trading form is used when the price of an asset is confined within a narrow price range. Range traders seek to profit from short-term price volatility by buying near the support line and selling near the resistance line.
- Breakout Trading: This chart pattern trading form involves taking positions when the price of an asset breaks through a significant level of resistance or support. Breakout traders aim to profit from medium-term price movements that may occur after a key level is breached.
- Retracement Trading: This chart pattern trading form involves taking positions when the price of an asset corrects after a prolonged trend. Retracement traders seek to profit from the long-term trend by entering positions when prices pull back.
- Reversal Trading: This chart pattern trading form involves taking positions when the price of an asset shows signs of a trend reversal. Reversal traders aim to profit from trend changes by taking positions opposite to the current trend.
- News Trading: This chart pattern trading form involves taking positions based on economic, political, or other news that may impact the market. News traders seek to profit from short-term price movements that may occur after the release of significant news.
- Algorithmic Trading: This chart pattern trading form uses computer algorithms to identify and execute trades based on predefined rules. Algorithmic traders aim to capitalize on market inefficiencies by taking positions quickly and using complex strategies to maximize profits.
In this article, we will specifically focus on chart pattern trading and draw a working hypothesis regarding Bitcoin.
Chart Patterns in Trading
Chart pattern trading utilizes technical analysis to identify various price patterns that repeat on financial charts. Here are the most commonly used chart patterns in pattern trading:
- Triangles: Triangles form when prices move within a narrowing range, with higher lows and lower highs converging. There are two types of triangles, ascending triangles and descending triangles, both indicating consolidation before a potential price breakout.
- Head and Shoulders: Head and Shoulders patterns form when prices reach a peak, then drop to a low, rise again to a higher peak, and then fall to a lower low. This chart pattern indicates a reversal of the current trend.
- Double or Triple Tops: Double or Triple tops form when prices reach a peak, drop to a low, rally back to a similar peak, and then fall again. This chart pattern can indicate a reversal of the current trend.
- Double or Triple Bottoms: Double or Triple bottoms form when prices reach a low, rally to a high, drop to a similar low, and then rally again. This chart pattern can indicate a reversal of the current trend.
- Channels: Channels form when prices move within a relatively narrow price range, with parallel upper and lower trendlines. Traders may look to buy from the lower trendline and sell from the upper trendline.
- Rectangles: Rectangles form when prices move within a relatively narrow horizontal range, with a support line at the bottom and a resistance line at the top. Traders may look to buy from the support line and sell from the resistance line.
Success Rate of Chart Pattern Trading
It is important to note that there is no universally agreed-upon success rate for different chart patterns in trading. Success depends on many factors such as market conditions, trading strategy, trader’s skills, and risk management.
However, here is a general list of success rates often associated with certain trading patterns:
| Chart pattern trading | The commonly accepted success rate |
| Triangles | 60-70% |
| Head and Shoulders | 65-75% |
| Double or Triple Tops | 60-70% |
| Double or Triple Bottoms | 60-70% |
| Channels | 55-60% |
| Rectangles | 60-65% |
| Shooting Stars or Hammers | 60-70% |
Figure 1: Probability of Occurrence of Chart Patterns in Trading
Note: These numbers are only general estimates and should not be considered as guarantees of success or failure for a specific chart pattern trading form. Traders should always conduct their own analysis and make decisions based on their own strategy and risk management.
Exercise in Style: Chart Patterns on Bitcoin
Now that we have defined what chart pattern trading is, let’s try to apply it to the Bitcoin price.
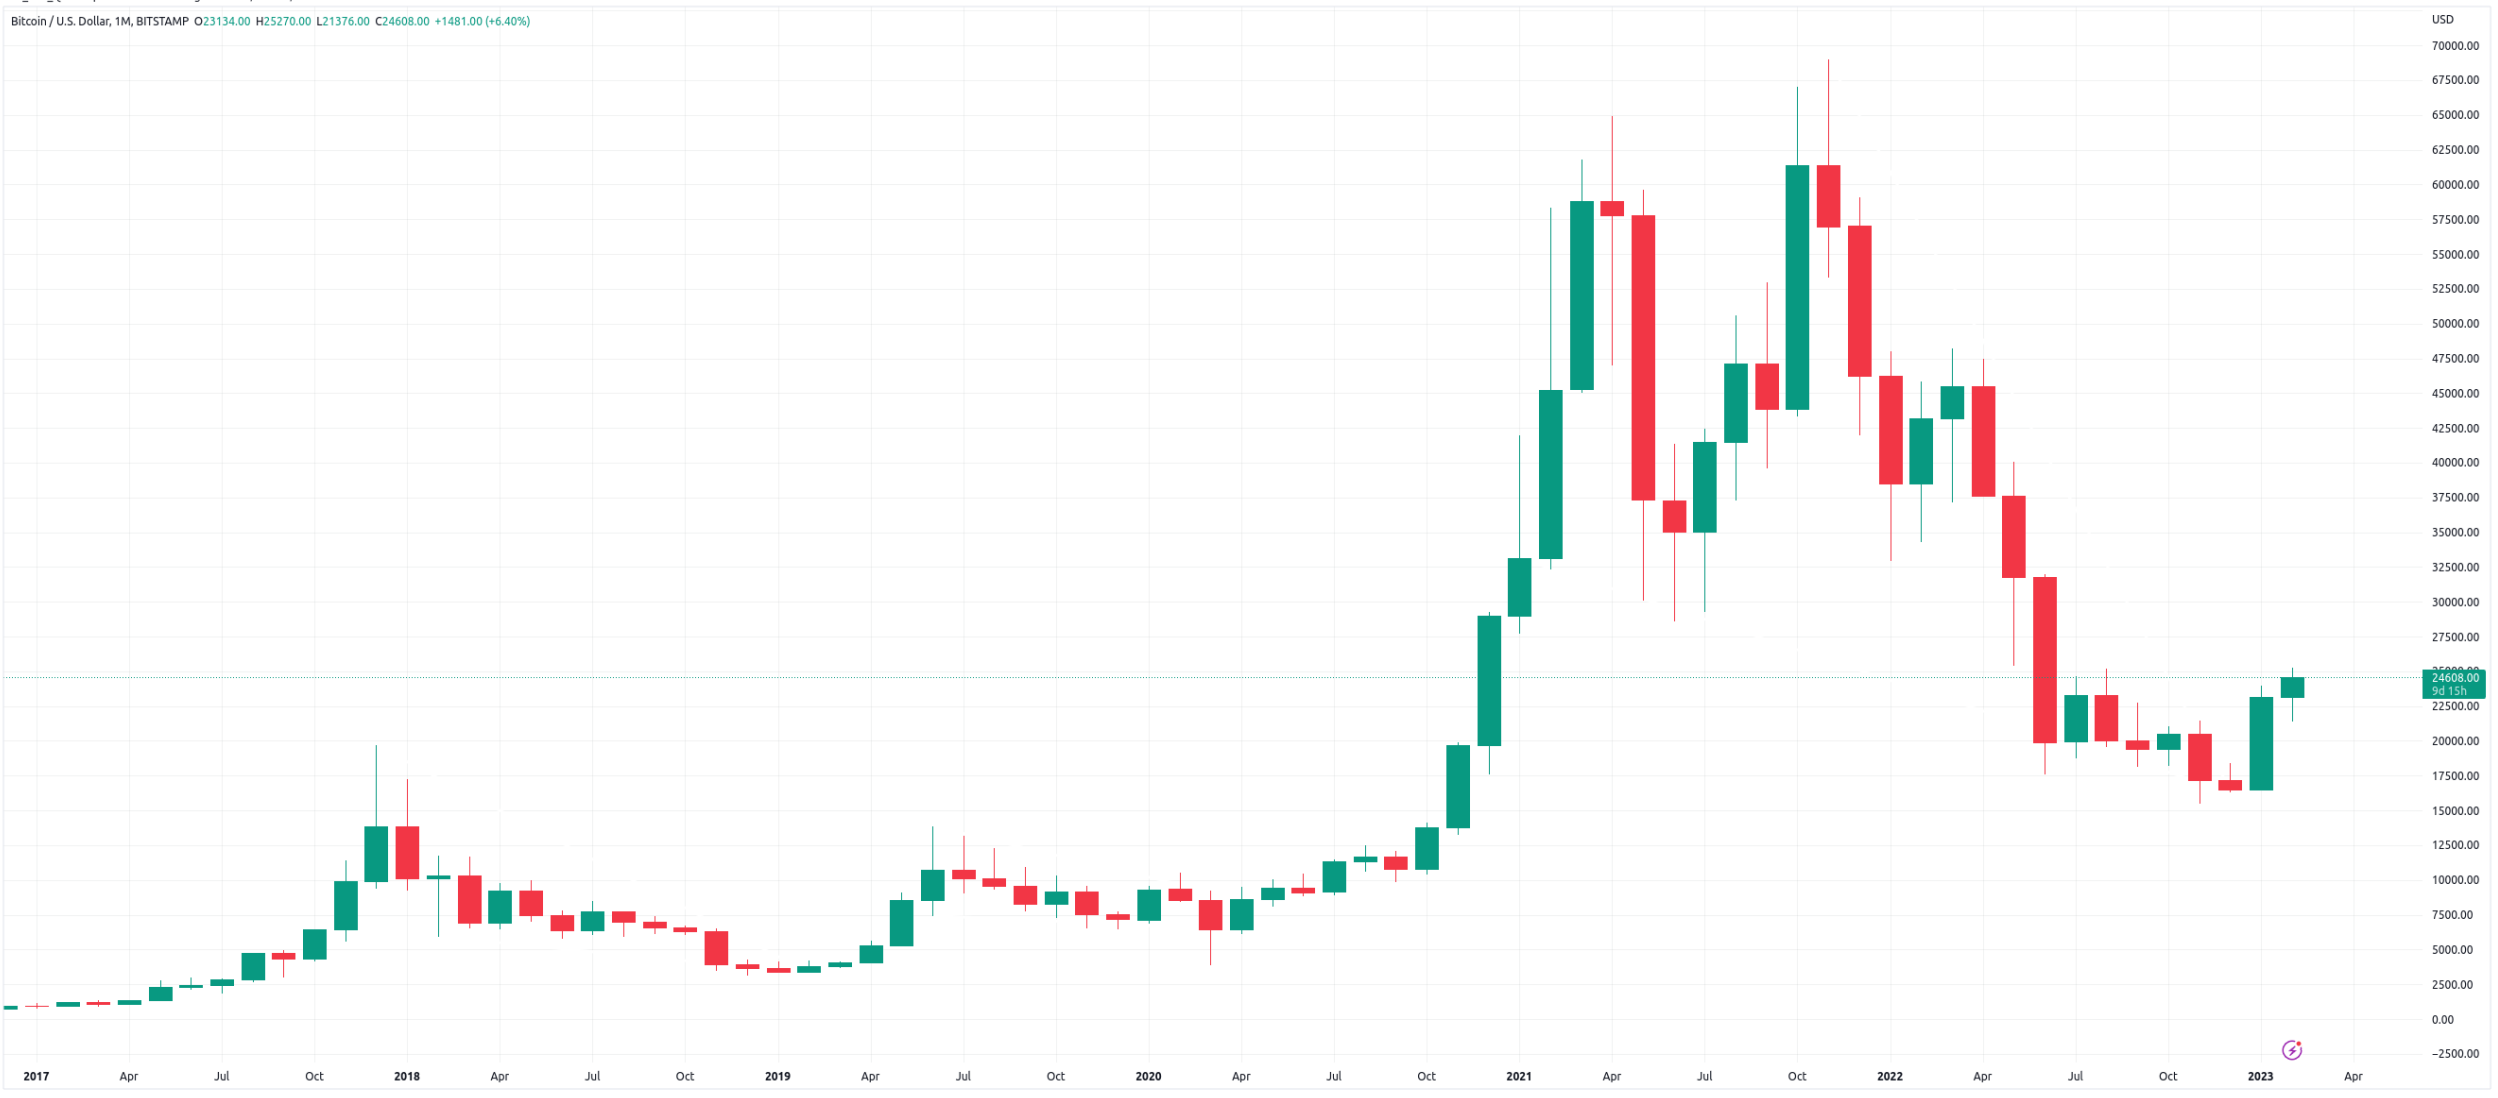
To perform this exercise, we will use the monthly candlestick chart of Bitcoin, which provides us with the following graph:

Figure 2: Bitcoin Price in Monthly Candlestick Chart
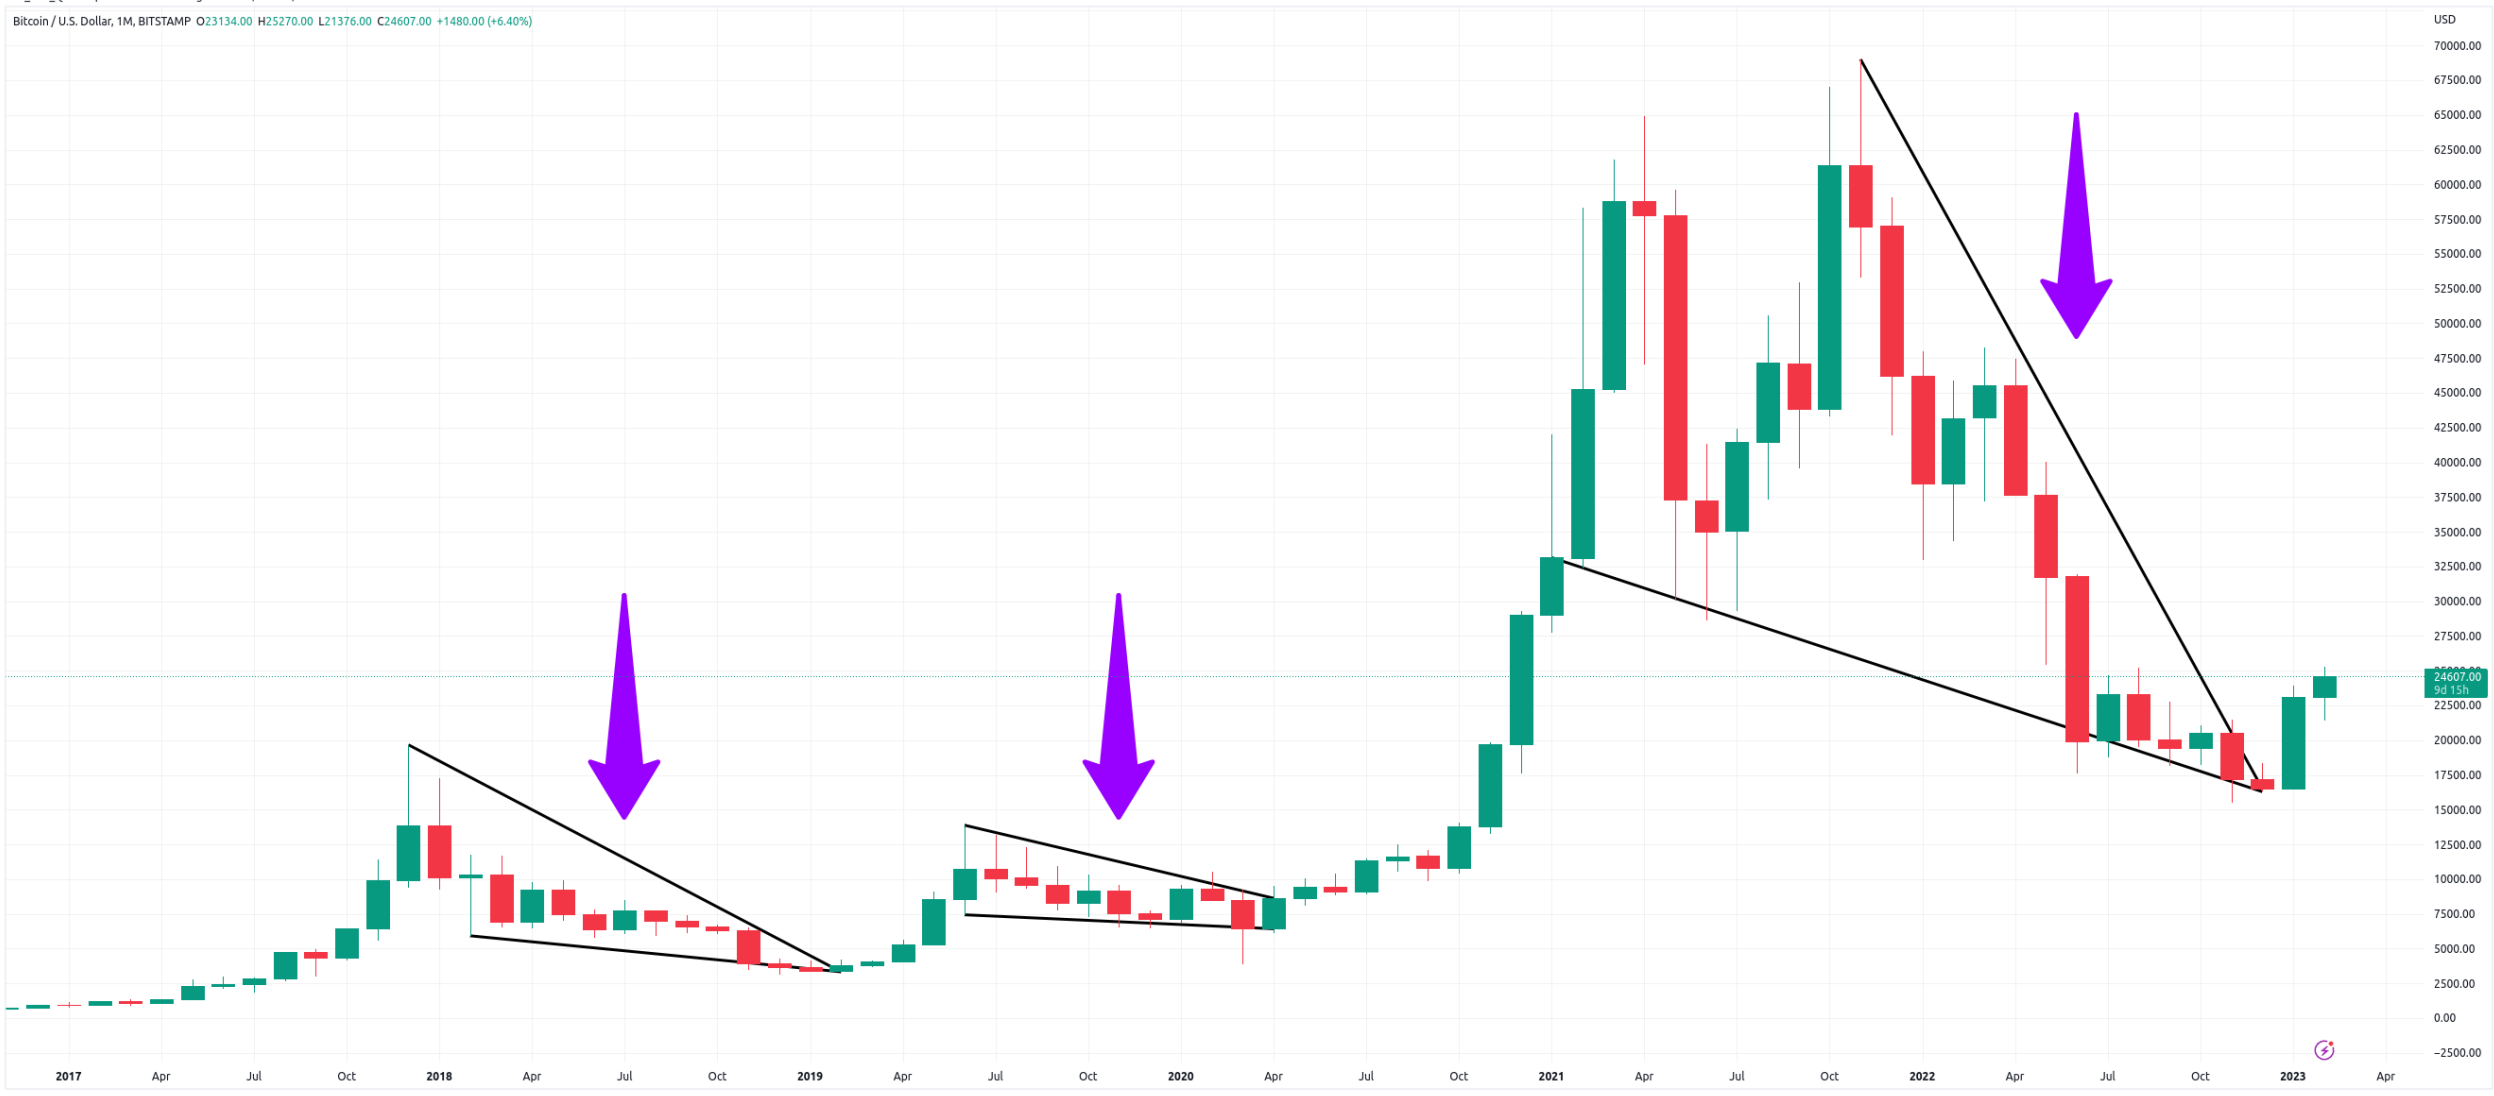
On this chart, we can now, based on our definition of chart patterns, identify several descending triangles (which, in the mystery of language, is a bullish pattern).
Here is how the descending triangles look when plotted on the Bitcoin chart:

Figure 3: Descending Triangles on Bitcoin Price in Monthly Candlestick Chart
Analysis (Attempt)
Based on the table in Figure 1, we know that the success rate of a triangle pattern is around 60-70%.
From our construction, it appears that on particularly long periods (monthly), the triangle pattern seems to be relatively reliable, as for each detection of this pattern, the Bitcoin price increases significantly.
It is not unnoticed that the Bitcoin price was in a descending triangle for several months and appears to have broken out of it since the beginning of the year with a 50% increase.
The Future
We can anticipate some movements, including a potential trend reversal (which everyone is waiting for). Indeed, triangles are reversal patterns (in correlation with the success rate in the table of Figure 1).
The triangle that is forming, according to analysts, around mid-2021 or early 2022 (which ultimately doesn’t make much difference), has been developing for several months and should provide a strong signal, especially considering that the Bitcoin price has broken out of this chart pattern with a respectable 50% increase since the beginning of 2023.
To confirm this trend reversal in favor of the bulls, it would be necessary for Bitcoin to establish itself comfortably above $25,000.
Lastly, but not least in the world of technical analysis, the RSI shows signs of bullish divergence, but that’s another story.
As Doris Day interpreted in the 1956 film “The Man Who Knew Too Much”: “Que Sera, Sera” (Whatever Will Be, Will Be).