Bitcoin vs. S&P500: The Sharpe Ratio
Investing in financial assets is a crucial decision for any investor, and choosing the right assets can make a significant difference in the final returns.
The Sharpe ratio is an effective tool for evaluating the performance of an investment. This indicator is commonly used to measure the risk-adjusted return by comparing the return to the volatility, taking into account the risk-free rate of return.
In this regard, investments in Bitcoin and the S&P500 have garnered great interest due to their respective performance and increasing popularity.
In this article, we will explore the Sharpe ratio for Bitcoin and the S&P500 to gain insights into their relative performance and potential as medium to long-term investments.
What is the Sharpe Ratio?
Created in 1960 by Nobel laureate William F. Sharpe, the Sharpe ratio is a metric that measures the excess return per unit of risk taken. Sharpe proposed that investors would only be willing to take financial risk if the expected performance exceeded that of a risk-free investment. Additionally, he argued that investors would prefer investments with higher returns relative to the risk taken.
Therefore, it is not necessary to compare the absolute volatility (annualized standard deviation of an asset’s returns) of assets, but rather the gross return per unit of volatility.
The Sharpe ratio is calculated as follows:

Avec :

is the expected return of the asset
(annualized average return)

is the rate of a risk-free investment.
(such as government bonds, fixed-term bank deposits, or money market products; typically, the benchmark rate is that of a 10-year U.S. Treasury bond)

is the volatility of the asset
Indeed, a Sharpe ratio greater than 0 indicates that the asset’s return is higher than a reference risk-free return. Conversely, when it is negative, it may be more advantageous to switch to a risk-free investment.
Moreover, when the Sharpe ratio is greater than 1, it indicates that the gross return (return minus risk-free return) is higher than the risk taken, making the investment attractive.
Return vs. Risk
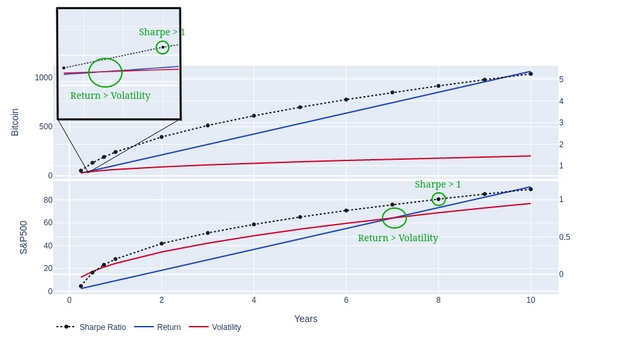
In this article, we will compare the long-term average return to the volatility of Bitcoin and the S&P 500. However, it is important to note that the average return assumes linear growth over time, while volatility grows according to the square root of time. Specifically, we have:


Figure 1: Returns, Performance, and Sharpe Ratio for Bitcoin and S&P500
The price data for Bitcoin is derived from the daily closing price of the BTC/USD pair on Bitstamp (August 2011 to February 2023), and for the S&P500 from the daily closing on Yahoo Finance (January 1990 to February 2023).
Figure 1 represents the annualized returns and risks (left y-axis) as well as the Sharpe Ratio (right y-axis) per year for Bitcoin and the S&P500. It can be observed that, on average, the S&P500 requires a period of 8 years before the gross return exceeds the risk, i.e., the Sharpe ratio is above 1, while Bitcoin only takes 3 to 6 months.
Furthermore, after a 10-year period, the S&P500 has a Sharpe ratio slightly above 1, while Bitcoin surpasses 5! This means that the risk-adjusted return is more than 5 times higher than the volatility, despite cryptocurrencies being among the most volatile asset classes (Bitcoin’s volatility often exceeds that of Lehman Brothers’ stock during its bankruptcy in 2008).
Historical Sharpe Ratio
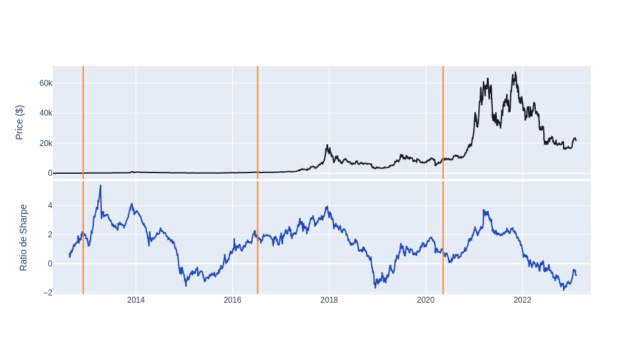
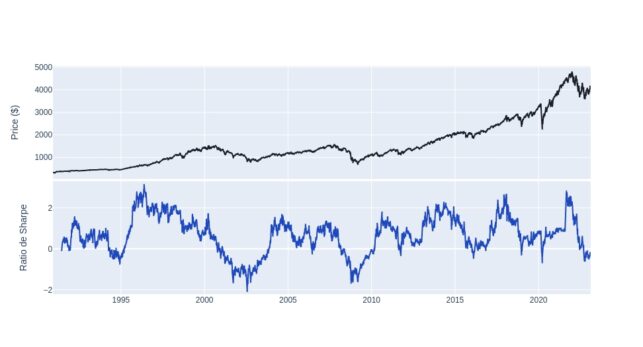
It can be useful to calculate the Sharpe ratio using rolling intervals to assess its evolution over time, as shown in Figures 2 and 3, which illustrate the price and Sharpe ratio trends for both assets. In 78% of cases, the Sharpe ratio for Bitcoin and the S&P500 is above 0.
However, only 35% of the time for the S&P500 and 60% for Bitcoin does the ratio exceed 1. This indicates that investing in Bitcoin may seem risky, but it offers a higher return compared to that risk.

Figure 2: Rolling Sharpe Ratio of Bitcoin
Indeed, as shown in Figure 2, there is a distinctive seasonality pattern in the digital asset. Each halving event, marked by the orange vertical lines, coincides with a significant appreciation in its value. This phenomenon can be attributed to the deflationary nature of Bitcoin and the increased interest from investors and individuals, leading to growing demand and a decreasing supply.

Figure 3: Rolling Sharpe Ratio of the S&P500
Conclusion
The analysis demonstrates that despite their higher volatility, investments in Bitcoin can be considered more attractive than the S&P500 in terms of the Sharpe ratio.
On average, it takes up to 16 times longer for the S&P500 (and the broader traditional finance sector) to achieve risk-adjusted returns that surpass the volatility, or in other words, to achieve a return on investment that justifies the risk taken.
Furthermore, after a significant downturn, it takes the S&P500 between 5 and 7 years to recover to pre-downturn levels, compared to 3 to 4 years for Bitcoin (halving cycles). This high volatility of crypto-assets can be risky if not properly managed, as it can result in both significantly high returns and sharp declines. However, this volatility is driven by relatively rapid price increases (around 3 years) and extremely swift downturns (around 1 year).
Ultimately, Bitcoin appears to be an intriguing option for long-term portfolio management, especially for those seeking a dynamic investment approach.
